Build an audience, then sell to that audience. This is one of my favorite strategies for building a business. And Barstool Sports is a perfect example of this. They have spent 18 years authentically building an audience, and because of this, they have been able to cash in with that audience.

Barstool Sports has 12.1M followers on Instagram, 3.1M followers on Twitter, 4m followers on Facebook, 923K subscribers on Youtube, and 15M followers on TikTok. They average 9M site visits per month to their website.
So, How Much Revenue Do They Generate From Their Merch Store?
Well… I am still trying to get to the bottom of it. I started tracking the Barstool Sports Store at the end of July. I noted, on one random day in June, Barstool Sports processed more than 1800 orders. Then, in July, they received over 54,000 orders (an estimated $1.9M in revenue). I assumed the summer months would be slow for their merch store, and they would see a pick-up in the fall.
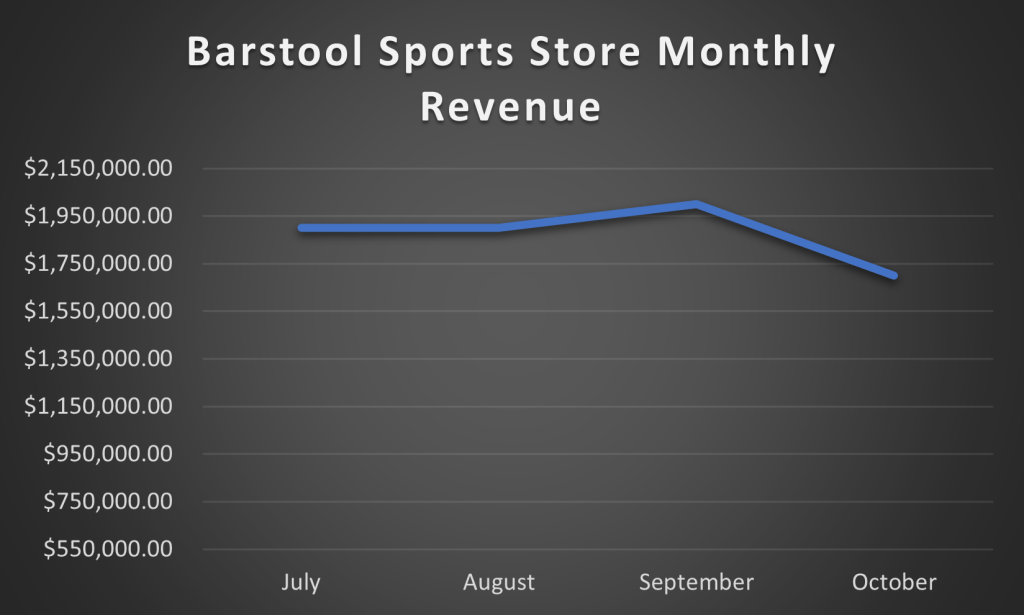
It would appear that I am wrong. It seems there was a slight revenue increase in September, but overall sales have been somewhat flat (averaging about 1800 orders per day).
Barstool Sports Store current run rate is about $25M in total revenue. However, that feels low to me. I know they will have a big push for Black Friday and Cyber Monday, and the Holidays. But that will only get them to $30m-$35M in total yearly revenue.
Why Are Barstool Sports Store Sales Flat? Have They Reached A Saturation Point?
I need to see more data, but here is what I am currently seeing. BarstoolSports.com site traffic has been relatively flat at about 9M visits per month for the past 6 months.

I assumed with College Football and the NFL coming back along with the MLB heading into the playoffs, there would have been an increase in site traffic and an increase in merchandise revenue. But I am not seeing that.
Top Selling Brands On Barstool Sports
- Call Her Daddy
- Saturdays are for the boys
- Fore-Play / Golf
- Barstool Outdoors
- Spittin Chicklets / Hockey
Call Her Daddy podcast is no longer on the Barstool Network (now on Spotify), but Barstool still has the rights to sell the merchandise for the brand. Saturdays are for the boys is a brand that is at least 5 years old and is not actively promoted on their website or on any of their content.
To me, this is signaling that there has not been any new brands or merchandise releases that is moving the needle in sales for their store.
In fact, they are probably just finding ways to fill the drop in merchandise sales for Call Her Daddy.
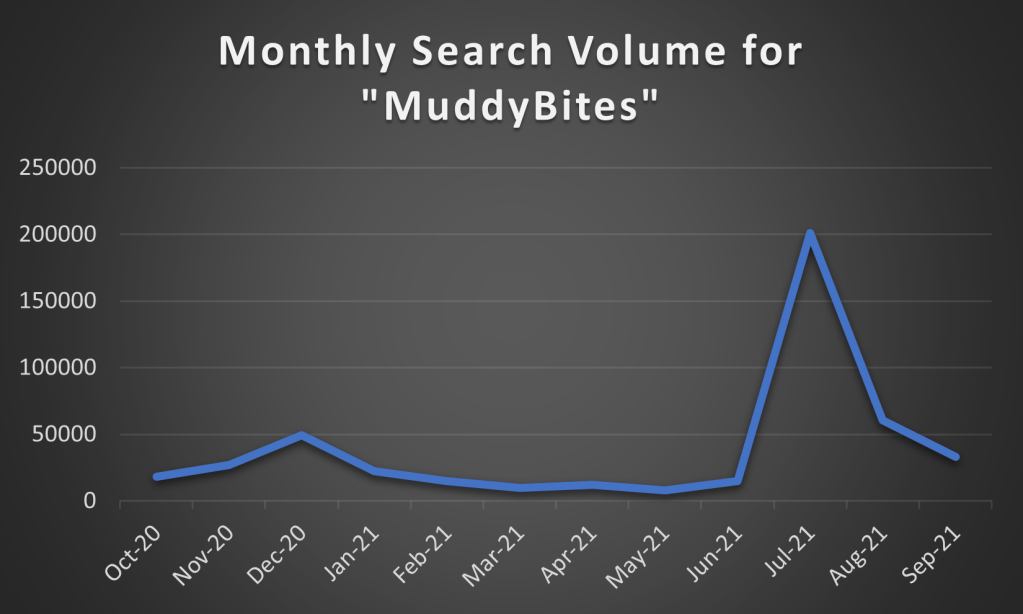
Call Her Daddy Data

As you can see “Call Her Daddy Merch” searches have been trending down. There was an explosion of searches during covid (and I think that coincided with their contract negotiations that went viral), but even in the last 6 months, searches for this merchandise has been trending down.
30% of all Barstool Store traffic lands on the Call Her Daddy Merchandise page. Their top Google ad that drives traffic to the Barstool Sports Store is for Call Her Daddy Merchandise.
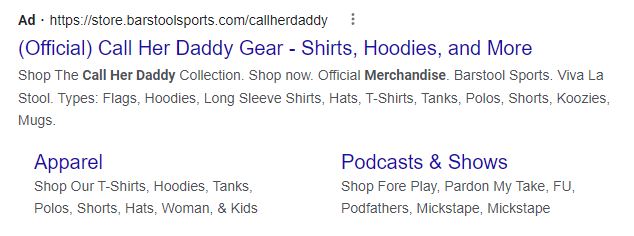
Barstool no longer owns this podcast and the macro interest in this merchandise appears to be down. Never mind its not even featured on their store’s home page. The sales for this product line has to be down and Barstool needs to find a way to replace that revenue.
Barstool Gambling
In years past, Barstool would make a good amount of its revenue from merchandise sales. There was a focus to make sure they were selling merchandise. Last year, Penn National Gaming took a 36% stake in Barstool and maybe the focus for Barstool switched from merchandise sales to generate revenue to gambling to generate revenue.
Barstool is now monetizing the audience they built through gambling, and it is possible that their merchandise sales have become second in priority.
Other Barstool Sports Store Data:
Top Performing Paid Keywords
- call her daddy sweatshirt
- barstool store
- call her daddy merch
- barstool shop
- barstool sports store
- barstool golf
Facebook Ads
Barstool currently has 100 active ads on Facebook. Only 6 of those ads were launched in October.
See Barstool Sports Facebook Ads
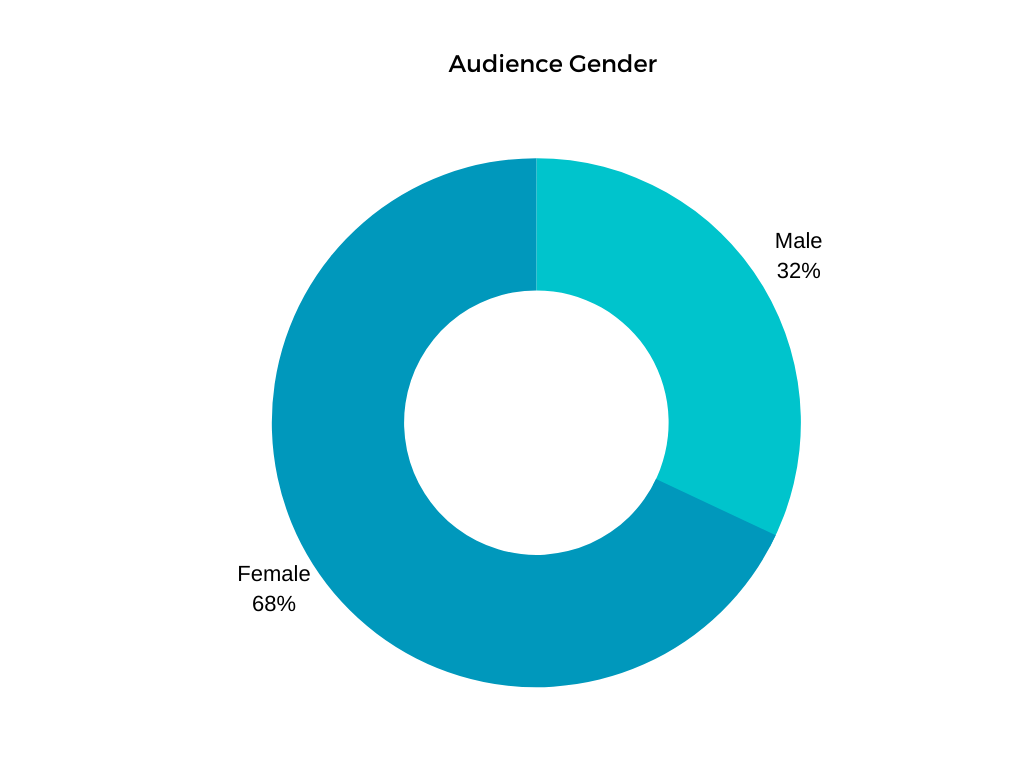
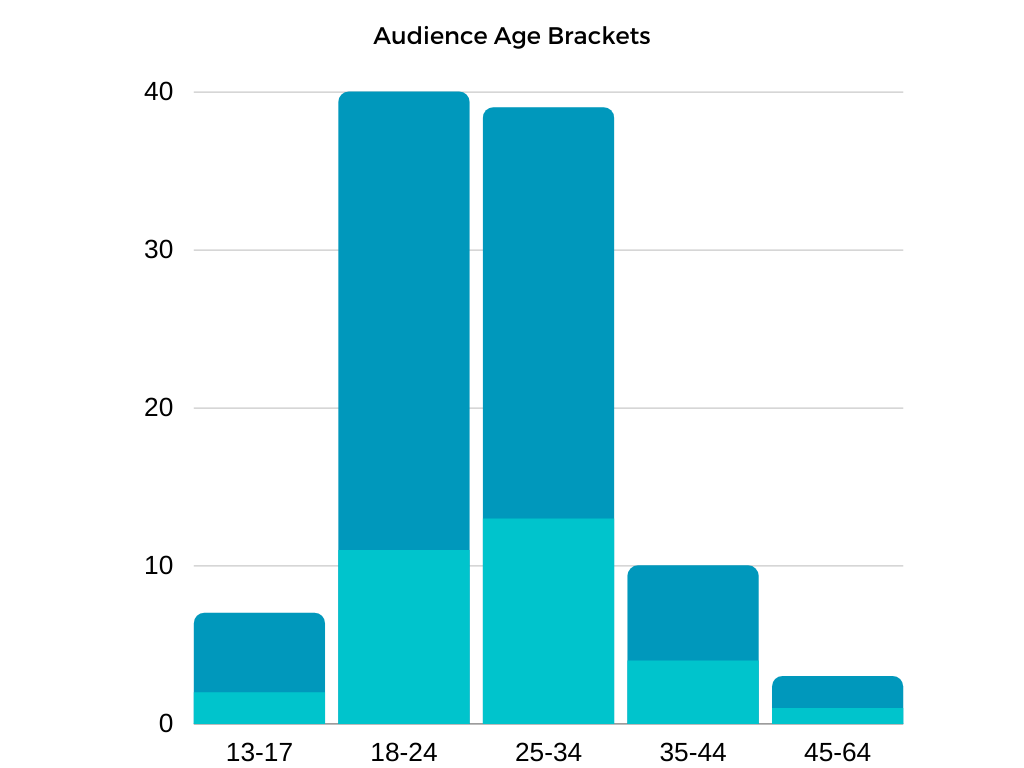
Audience Demographics
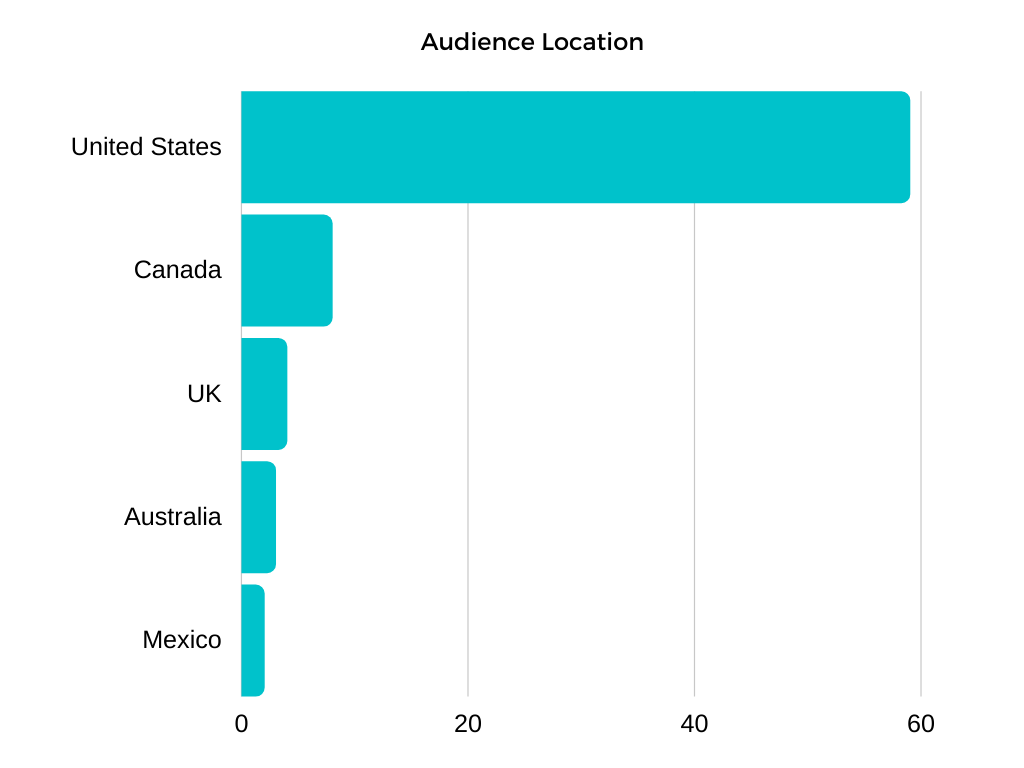
71% Male/29% Female. 78% of their audience is between the ages of 18-34. 83% of their audience is based in the United States
—-
As I said before, I would need to see year over year data to accurately assess my assumption that Barstool Sports Store sales have leveled off. There is a chance this is part of some seasonality but again, logic would tell me that as college football and NFL return their merchandise revenue would increase. Next month, I will return recapping their Black Friday/Cyber Monday sales event!